|
Storm of the
Century - Hurricane Floyd
|
|
|
|
|
|
Hurricane
Floyd was one of five major hurricanes that hit in 1999. Although
it had weakened by time it reached the coast, hurricane Floyd was
responsible for the largest peacetime evacuation in the history of
the US.
by Richard J. Pasch
Floyd can be traced back to a tropical wave that emerged from western
Africa on 2 September. This system was not particularly impressive-looking,
in terms of the organization of the convection shown on satellite
images, but there was evidence of curvature in the cloud lines.
Overall the system was broad and disorganized, yet easily recognizable
as a synoptic-scale entity.
The wave proceeded westward across the eastern tropical Atlantic
at about the normal speed of propagation, 6 degrees of longitude
per day, with little apparent change, for several days. A center
of circulation was estimated late on 5 September near 15N 32.5W
but the cloud pattern lacked sufficient deep convection for a Dvorak
classification. On 6 September, there was enough of a curved band
of deep convection present so that the system was classified as
a T1.0 on the Dvorak scale around 1200 UTC. A favorable upper-level
outflow pattern existed over the area, and the cloud pattern became
more consolidated and better organized on the 7th. Tropical Depression
Eight formed about 1000 miles east of the Lesser Antilles by 1800
UTC that day.
A deep-layer ridge prevailed to the north of the cyclone and the
associated steering current moved the system west-northwestward
at 12-15 knots for a couple of days. When it reached a position
about 750 n mi east of the Leeward Islands, the cloud pattern became
sufficiently well organized for the system to become Tropical Storm
Floyd around 0600 UTC 8 September. Even though large-scale conditions
appeared conducive for strengthening, there was a lack of a well-defined
inner core. This was evidenced by visible, infrared, and microwave
imagery that showed no tightly curved banding features or a concentration
of deep convection close to the center, a condition that probably
prevented rapid intensification during the early stages of the tropical
cyclone. Floyd slowly strengthened and became a hurricane by 1200
UTC 10 September while centered about 200 n mi east-northeast of
the northern Leeward Islands.
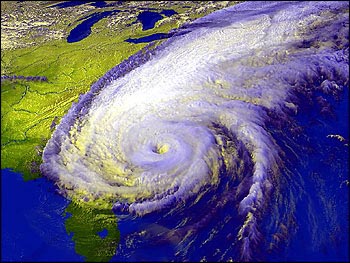
NASA
Hurricane Floyd as it heads towards the Carolinas
|
As Floyd was nearing hurricane status, a mid-tropospheric trough
in the vicinity of 60-65W longitude caused a slowing of the forward
speed, and then a turn toward the northwest. The northwestward motion
continued until the 11th, keeping the hurricane well to the northeast
of the islands of the northeastern Caribbean. On the 11th, Floyd
neared the southwest portion of the mid-Atlantic upper-tropospheric
trough which was situated to the north of Puerto Rico, i.e. close
to its climatological position. Historically, hurricanes have had
difficulty strengthening in this area. Floyd's upper-level outflow
was disrupted over the southern semicircle by the trough and an
anticyclone over the eastern Caribbean. Consequently, after strengthening
nearly to category three status early on the 11th, the hurricane
weakened to 85 knots around 0000 UTC on the 12th. Early on the 12th,
rising mid- to upper-tropospheric heights to the north of Floyd
forced a turn toward the west. The westward turn also marked the
beginning of a major strengthening episode (this phenomenon has
also been observed with many past hurricanes, e.g. Andrew of 1992).
Maximum sustained winds increased from 95 knots to 135 knots, and
the central pressure fell about 40 mb from early on the 12th to
early on the 13th. From 0600 to 1800 on the 13th, Floyd was at the
top end of category four intensity on the Saffir/Simpson Hurricane
Scale.
One potential contributor to the significant strengthening of Floyd
was the presence of enhanced upper oceanic heat content along its
track. Analyses from the Physical Oceanography Division of NOAA/AOML
showed relatively high values of heat content just to the east of
the Bahamas a day or two before Floyd passed through the area.

Dave Gatley/FEMA News Photo
One
of the many homes destroyed by Floyd
|
Floyd was aimed at the central Bahamas until late on the 13th,
when the heading became west-northwestward. The eye passed just
20 to 30 n mi northeast and north of San Salvador and Cat Islands
on the night of the 13th. Floyd's eyewall passed over central and
northern Eleuthera on the morning of the 14th, and after turning
toward the northwest, Floyd struck Abaco island on the afternoon
of the 14th. By the time the hurricane hit Abaco, it had weakened
somewhat from its peak, but Floyd was still a borderline category
three/four hurricane.
As a mid- to upper-tropospheric trough over the eastern United
States eroded the subtropical ridge over the extreme western Atlantic,
Floyd continued to turn gradually to the right. The center of the
hurricane paralleled the central Florida coast, passing about 95
n mi east of Cape Canaveral around 0900 UTC 15 September. By the
afternoon of the 15th, Floyd was abeam of the Florida/Georgia border
and headed northward toward the Carolinas.
Although there was a fluctuation in intensity, related to an eyewall
replacement event discussed in the next section, overall the intensity
of Floyd diminished from the 13th to the 15th. Environmental causes
for intensity change are not entirely understood, but two large-scale
factors probably contributed to a gradual decline: the entrainment
of drier air at low levels from the northwest, and increasing south-southwesterly
vertical shear. As Floyd neared the North Carolina coast late on
the 15th, its maximum winds decreased below category three status.
After turning toward the north-northeast with forward speed increasing
to near 15 knots, Hurricane Floyd made landfall near Cape Fear,
North Carolina at 0630 UTC 16 September as a category two hurricane
with estimated maximum winds near 90 knots. Floyd was losing its
eyewall structure as it made landfall. Continuing to accelerate
north-northeastward, Floyd's center passed over extreme eastern
North Carolina on the morning of the 16th and over the greater Norfolk,
Virginia area around 1500 UTC that day. Floyd then weakened to a
tropical storm and moved swiftly along the coasts of the Delmarva
peninsula and New Jersey on the afternoon and early evening of the
16th, reaching Long Island by 0000 UTC 17 September. By that time,
the storm's forward speed had increased to near 29 knots. The system
decelerated as it moved into New England.
By late on the 16th and early on the 17th, Floyd was becoming more
involved with a frontal zone that existed along the Atlantic seaboard.
The system took the form of a frontal low and thus became extratropical
by the time it reached the coast of Maine at 1200 UTC 17 September.
The cyclone turned toward the northeast and then east-northeast,
moving over the coast of New Brunswick late on the 17th, Prince
Edward Island early on the 18th and Newfoundland late on the 18th
and early on the 19th. Floyd's extratropical remnant merged with
a large extratropical low over the north Atlantic and was no longer
a distinct entity by 1800 UTC 19 September.

NASA
Brown
sediments clogged coastal estuaries a week after the storm
|
Meteorological Statistics
The peak intensity of Floyd, 135 knots, is based upon roughly 90%
of the highest flight level (700 mb) winds of 149 knots at 0933
UTC 13 September. Minimum dropsonde-measured central pressure was
921 mb at 1121 UTC on that date.Floyd is estimated to have been
a 90-knot hurricane at landfall in North Carolina.
There was a 10 meter anemometer measurement of sustained winds
of 83 knots at 0710 UTC with gusts to 106 knots at 0716 UTC taken
by University of Oklahoma meteorology professor Josh Wurman near
Topsail Beach North Carolina. There were also unofficial reports
of peak wind gusts to 120 knots (at 8 stories elevation) at Wrightsville
Beach and 104 knots at the Wilmington Emergency Operations Center.
Heavy rainfall preceded Floyd over the mid-Atlantic states due
to a pre-existing frontal zone and the associated overrunning. Hence,
even though the tropical cyclone was moving fairly quickly, precipitation
amounts were very large. Rainfall totals as high as 15 to 20 inches
were recorded in portions of eastern North Carolina and Virginia.
At Wilmington, North Carolina, the storm total of 19.06 inches included
a 24-hour record of 15.06 inches. Totals of 12 to 14 inches were
observed in Maryland, Delaware, and New Jersey. New records were
set in Philadelphia for the most amount of rain in a calendar day,
6.63 inches. In southeastern New York, rainfall totals were generally
in the 4 to 7 inch range but there was a report of 13.70 inches
at Brewster. Totals of nearly 11 inches were measured in portions
of New England. Storm surge values as high as 9 to 10 feet were
reported along the North Carolina coast.
A number of tornadoes were sighted in eastern North Carolina. There
was a confirmed tornado in Bertie County and another in Perquimans
County. The latter tornado destroyed two houses and damaged three
or four others. At least ten tornadoes were reported by spotters
in the Newport/Morehead City County Warning area, and these apparently
caused some structural damage. Four tornadoes or funnel clouds were
seen in the Wilmington area, but no damage was apparent.
Casualty and Damage Statistics
There were 57 deaths that were directly attributable to Floyd,
56 in the United States and 1 in Grand Bahama Island. The death
toll by state is as follows: North Carolina 35, Pennsylvania 6,
New Jersey 6, Virginia 3, Delaware 2, New York 2, Connecticut 1,
and Vermont 1. Most of these deaths were due to drowning in freshwater
flooding. Floyd was the deadliest hurricane in the United States
since Agnes of 1972.
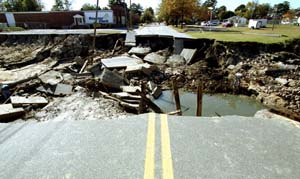
Dave Gatley/FEMA News Photo
A
bridge in North Carolina has been completely washed away by
flooding
|
In the United States, the Property Claims Services Division of
the Insurance Services Office reports that insured losses due to
Floyd totaled 1.325 billion dollars. Ordinarily this figure would
be doubled to estimate the total damage. However, in comparison
to most hurricane landfalls, in the case of Floyd there was an inordinately
large amount of freshwater flood damage, which probably alters the
two to one damage ratio. Total damage estimates range from 3 to
over 6 billion dollars.
Forecast and Warning Critique
Official intensity forecasts were fairly good (errors of 10 knots
or less) for the first couple of days of Floyd's history. However,
there were some large underforecasts of intensity, by as much as
30 to 40 knots, from 10-12 September. After Floyd reached its maximum
intensity, the official forecasts did not show enough weakening.
From 13 September onward, the wind speed was overpredicted in the
advisories at practically every forecast time interval, by as much
as 30 to 40 knots, and even 50 knots in one occasion. The Statistical
Hurricane Intensity Prediction Scheme, SHIPS, performed similarly.
A hurricane warning was issued for the northwest Bahamas more than
24 hours prior to the arrival of the eyewall at Eleuthera. For the
United States, practically the entire east coast (the greater Miami
area northward to Plymouth Massachusetts) was put under a hurricane
warning for Floyd. To the authors' knowledge, the last time such
an event occurred was during Hurricane Donna of 1960. Hurricane
warnings for the southeast Florida coast proved unnecessary. However,
given the forecast uncertainty and the required response times for
evacuations and other preparations for such a large, severe hurricane,
it was prudent to issue such warnings. The hurricane warning was
issued for the coast of North Carolina at 0300 UTC 15 September.
This is about 26-27 hours prior to the arrival of the eyewall in
the Cape Fear area. Generally, for the coasts of South and North
Carolina, hurricane warnings were issued at least 24 hours before
the onset of tropical storm force winds.
According to preliminary information provided to the Federal Emergency
Management agency, over 2 million people were evacuated for Floyd
in the United States. This is probably the largest evacuation in
U.S. history.
Acknowldedgements
Some of the data in this report was furnished by local National
Weather Service Offices in Miami, Melbourne, Jacksonville, Charleston,
Wilmington, Newport/Morehead City, Raleigh/Durham, Wakefield, Baltimore/Washington,
Mount Holly, New York, and Taunton. Stephen Baig produced the track
chart, and James Franklin produced the wind and pressure plots.
|
|
|
|
|