|
We are currently in the middle of the 11 year solar cycle, with
the Earth experiencing the effects through changes to radio communications,
power distribution, orbiting spacecraft and even the weather. So
predicting what the Sun will do next is in all our interests.
by Leslie Mullen
Most people think of the sun as a featureless,
unchanging ball of light. But the Sun actually has seasons, or cycles
of activity and relative inactivity. Right now, we are in the middle
of the maximum activity phase of the current 11 year solar cycle.
The Sun is daily exhibiting many sunspots and flares. We feel the
effects of an active Sun here on Earth - radio communications, power
distribution, orbiting spacecraft and even the weather are all affected.
Sunspots are relatively cool areas
on the Sun that appear as dark blotches. Scientists count the number
of sunspots to measure the magnitude of a solar cycle, and to determine
how long the cycle lasts. If scientists were able to predict sunspot
activity, not only would we know ahead of time what the Sun will
do, but we might gain a better understanding of how the Sun operates.
Dr. David Hathaway, along with Robert
Wilson and Ed Reichmann, looked at many different ways scientists
predict sunspot activity. They tested each statistical method to
see which worked best, and then combined the top two methods to
develop an even better prediction method of their own.
"There are many different ways of predicting
the sunspot cycle," says Hathaway. "but until now there has never
been a systemic study to determine whether one method works better
than another. After examining various methods, we found that some
of the techniques currently used and touted are basically useless."
By looking at more than 15 methods,
the scientists found that 8 or 9 were better than average at predicting
solar maxima - when the sun is at its most active. The two best
methods essentially used the same information - disturbances in
the Earth's magnetic field.
"Explosions from the sun travel through
space and hit the Earth, causing the magnetic field to wobble and
shake," says Hathaway.
Joan Feynman from NASA's Jet Propulsion
Laboratory developed one of the top two methods, the Australian
astronomer Richard Thompson developed the other. Although each scientist
took a different approach to the data and reported different results,
they both looked at how the Earth's magnetic field shook during
the previous solar cycle to predict the sizeof the next one.
Solar Activity
affects the Earth's Magnetic Field.
|
Scientists don't know why previous solar
activity is connected to the next active period, or why the Earth's
reaction to that activity helps in solar cycle prediction. But the
connection allows scientists to estimate what the next solar season
will bring.
The statistical model developed by
Hathaway's team uses both Feynman's and Thompson's methods and integrates
them with a curve-fitting technique. The "precursor" methods used
by Feynman and Thompson try to determine the total number of sunspots
that will appear before the season actually begins.
The curve-fitting method finds the
best curve to fit recent solar activity. Based on years of observations,
solar scientists have developed a library of curves that follow
the average of solar cycles. By using their prediction method, Hathaway's
team can pick a curve from this library before the solar cycle even
begins, and than make adjustments as the cycle progresses.
For the current solar cycle, Hathaway's
team predicted an average sunspot maximum of 154, with an uncertainty
of plus or minus 20. This prediction has a narrower range of error
than a previous, widely accepted prediction, which placed the sunspot
maximum at 160 with an uncertainty of 30.
Graph of predicted
sunspot activity
|
"We are in a period where the sun is
very active," says Hathaway. "Until mid 2001, we'll see daily sunspot
numbers between 100 and 300, with an average around 154."
After that, solar activity will begin
a slow descent into solar minimum. So far, the Sun seems to be following
the curve picked by the scientists.
"Monthly values are actually jumping all over the place," says Hathaway.
"You have to remember the curve is only an average of what is really
going on."
On one day for example, the Sun had
a sunspot number above 300 - far more than the 154 average. But
for the previous 5 months, there were fewer sunspots than expected.
The average number of sunspots met in the middle to follow the curve
picked by Hathaway's team.
As good as this method is,"physical models to predict sunspot activity
several years in advance are not available," says Hathaway. "We
don't understand well enough why the sun does this to be able to
predict like a meteorologist does."
A meteorologist can input weather factors
like temperature and barometric pressure into a computer model to
get a weekly forecast. Solar predictors don't have a physical model,
however, because they still don't know how all the factors of the
Sun's activity work together.
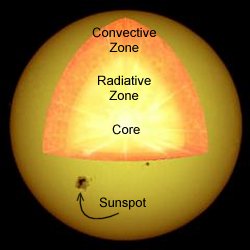
The Suns Four
Regions
|
A simple model of the Sun shows the
solar interior separated into four regions. Energy is produced in
the core, and this energy radiates outward through the radiative
zone in the form of gamma-rays and x-rays. In the convective zone,
fluid flows in a boiling motion. These fluid motions are visible
as granules and supergranules on the surface of the Sun. A thin
layer where the Sun's magnetic field is thought to be generated
lies between the convective and radiative zones.
Hathaway, along with most other solar
astronomers, believes the Sun's magnetic field is the key to understanding
the solar cycle. Sunspots are formed when magnetic field lines just
below the Sun's surface become twisted and poke through the solar
photosphere. The photosphere - or "ball of light" - is the familiar,
visible surface of the Sun.
The Sun is actually a ball of gas,
so it does not rotate rigidly like solid planets and moons do. Instead,
the Sun's equatorial regions rotate faster than the polar regions.
Because of this "jet stream" near the equator, the magnetic fields
become wrapped around the Sun.
"The magnetic field is a lot like a
rubber band," says Hathaway. "Fluid flows within the Sun called
'dynamos' stretch, twist and fold the band, wrapping it around the
sun many times over 11 years. When the magnetic field loops into
the Sun's convective zone, it rapidly rises to the surface. As it
rises, it twists a little bit. This provides a change in field direction
that helps to reverse the poles."
The Sun's magnetic poles reverse at
solar maxima. Starting at the equator, a slow flow at the surface
drags the magnetic field toward the poles. Conversely, sunspots
first appear in the mid-latitudes and then congregate toward the
equator later in the solar cycle.

Computer animation
of the Sun's magnetic field lines.
|
The extra ultraviolet (UV) and X-ray
radiation created by the magnetic field around sunspots causes the
Earth's atmosphere to heat up and expand. This creates added drag
in the area where satellites and the Space Shuttle orbit. This drag
could slowly pull such spacecraft out of orbit earlier than expected.
The extra UV produced by sun spot activity also increases the amount
of ozone in the Earth's upper atmosphere.
Although sunspots are cooler areas
on the solar surface, the Sun is actually hotter when sunspots appear
and cooler when they are absent. Scientists believe that a long
period of solar inactivity may correspond with colder temperatures
on Earth. From 1645 to 1715, astronomers observed very little solar
activity. This time period coincides with an era known as the Little
Ice Age, when rivers and lakes throughout Europe (and perhaps the
world) froze.
Although there are good records of
solar activity since the invention of the telescope in 1610, scientists
have to look toward other sources to determine if there were even
earlier periods of low solar activity. Because it is believed that
sun spot activity correlates to the amount of Carbon 14 and Beryllium
10 in the environment, scientists can use ice core samples on Earth
to determine solar activity levels.

Sun and Earth
|
"We can go back in time, before telescopes,
by looking at ice core samples," says Hathaway. "Based on these
samples, there appears to have been other, earlier sunspot minima."
In 1843, the amateur astronomer Heinrich
Schwabe found that sunspots come and go in a predictable 11-year
cycle. Ever since that announcement, many have tried to correlate
the Sun's cycle with all sorts of events on Earth - some have even
believed the Sun influences the stock market! Although there is
no evidence that solar activity affects economic trends, by predicting
what the Sun will do in the future we can better prepare for the
many other impacts solar activity has for life on Earth.
|