|
Scientists are working to understand why the
lower atmosphere isn't heating up as fast as some global warming
models predict.
by Patrick L.Barry
How could the globe be warming and not warming at the same time?
That's the riddle posed to climatologists by satellite and radiosonde
(balloon-borne instrument for making atmospheric measurements) data
which show that while the Earth's surface has been warming over
the past decades, the lowest layer of the atmosphere shows a weaker
warming trend.
The measurements are surprising, because computer simulations of
the world's climate predict that the two lowest layers of the atmosphere
-- which together form the "troposphere" -- should be
warming faster than the Earth's surface.
"I think it points out that the atmosphere is more complex
than the computer models currently simulate," says Dr. Roy
Spencer, senior scientist for climate studies at the Global Hydrology
and Climate Centre (GHCC) at NASA's Marshall Space Flight Centre.
"However, it does not by itself substantially alter the expectation
that some amount of global warming will occur in the future."
Spencer and
Dr. John Christy, a professor of atmospheric science at the University
of Alabama in Huntsville, are trying to account for the unexpected
temperature patterns. By explaining the contrary behaviour of atmospheric
and surface-level temperature trends, they hope to improve computer
models used to simulate the world's climate. This would provide
a better picture of how severe or mild global warming will be over
the next century.
"I believe the data bolster the traditional scientific scepticism
one must have when discussing predictions of the future," Christy
said.
A recent National Research Council report states: "For the
time period from 1979-1998, it is estimated that on average, over
the globe, surface temperature has increased by 0.25 to 0.4 degrees
C and lower to mid-tropospheric temperature has increased by 0.0
to 0.2 degrees C." These are stated as ranges because of measurement
uncertainties in each. Current climate models predict that the layer
of the atmosphere called the "lower troposphere" -- which
extends from the surface to an altitude of about 5 miles -- would
be warming at a slightly faster rate than the surface.
Global
Warming Ranges
|
But satellite measurements
of temperatures in the lower troposphere over the last 21 years
don't agree with that prediction. Collected by the National Oceanic
and Atmospheric Administration's TIROS-N series of weather satellites,
the data show only a slight net warming of 0.05 degrees Celsius
per decade.
What
could possibly be causing these unexpected trends? Right now, there
are only theories.
"Stratospheric ozone depletion, unknown effects related to
the major volcanic eruptions and the infrared effect of aerosols
have all been bounced around as ideas, but none has had serious
work done on them," Spencer said.
Some scientists suspect that the record of surface temperature warming
has been exaggerated by the so-called "asphalt effect,"
creating unrealistically high expectations for the warming of the
troposphere.
Thermometers used to calculate the average surface temperature are
usually located in areas easily accessible by people. In industrial
countries, the thermometers are most often found at airports. It
is not clear what fraction of the observed warming of the Earth's
surface is due to the influence of "urban heat islands"
(Heat islands are created when city growth alters the urban fabric
by substituting manmade asphalt roads and tar roofs and other features
for forest growth) on the measurements.
"I believe there are still urban warming biases in the global
thermometer record that are exaggerating the global warming signal,"
Spencer said. "I don't think it will be possible to remove
these biases since virtually all thermometer sites have experienced
changes in their microclimate due to (humanity's) activities."
The satellites, on the other hand, sweep over almost the entire
globe as they take their measurements, covering about 95 percent
of the Earth's surface. Oceans and continents, forests and factories
are all incorporated into the satellite figures.
Most of the current work at GHCC focuses on improving and expanding
the body of data to provide a clearer, more detailed picture of
the long-term temperature patterns of the atmosphere.
For example, Christy is trying to expand the atmospheric temperature
record to before 1979 -- which is when the first of the TIROS-N
satellites was put in orbit -- by using data from radiosonde balloons.
Potentially, the balloon data could extend the record back to the
late 1950s.
Also, a new version of the temperature sensors used by the satellites
will improve the detail of the measurements taken. The new Advanced
Microwave Sounding Unit (AMSU) sensors can detect temperatures in
the upper stratosphere, which is the atmospheric layer above the
highest layer that the older sensors could measure. The new sensors
can also distinguish between more sub-layers of the troposphere
-- the layer where most weather occurs.
The first AMSU sensor was launched into space in May of 1998 aboard
the NOAA-15 satellite, and data from that sensor are already being
incorporated into the daily temperature updates produced by Spencer.
Another AMSU sensor is scheduled to launch in late August aboard
the NOAA-16 satellite, and the Aqua satellite and the European Space
Agency's MetOp series of polar-orbiting satellites will also bear
the sensors.
"AMSU sensors are what's going to be providing our temperature
information from satellites for the foreseeable future," Spencer
said.
The improved temperature
record will guide efforts to refine computer models of the world's
climate so that the behaviour of the models more closely resembles
the observed behaviour of the atmosphere.
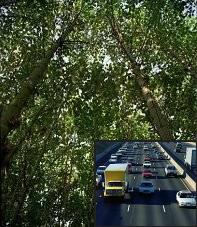
Is
Forest being eclipsed by Roads?
|
Current models suffer from several shortcomings.
For example, clouds are not well represented by the models. The
resolution of current models is too coarse for features as small
as clouds, Spencer said. Yet clouds clearly play a crucial role
in climate due to their influence on humidity, precipitation and
albedo (the percentage of solar energy reflected back into space
as light).
"The role of clouds is still regarded as one of the biggest
uncertainties in global warming predictions," Spencer said.
The ability of plants to remove carbon dioxide from the atmosphere
and the role of soils have only recently been added to the models,
and scientists aren't confident yet of how the models portray these
factors, Spencer said.
"While we know that vegetation takes up some of the carbon
dioxide we generate from burning of fossil fuels, how that sink
of carbon will change in the future is still pretty uncertain,"
Spencer said.
Climate models are also limited by the computing power available.
"The global models would be much better if computers were much
faster," Spencer said. "Instead, a lot of approximations
are made to make the models simple enough to do climate simulations
over the whole globe.
"Unfortunately," Spencer continued, "we know that
many of the processes that are crudely represented are quite non-linear,
and so have the potential to respond in unexpected ways."
|