|
Is human activity warming the Earth or do recent signs of climate
change signal natural variations? In this article, Patrick L.Barry
from NASA discusses the vexing ambiguities of our planet's complex
and unwieldy climate.
by
Patrick L.Barry
Newspaper headlines trumpet record-breaking
temperatures, dwindling sea ice, and retreating glaciers around
the world. Concentrations of atmospheric carbon dioxide, one of
the greenhouse gases responsible for scalding temperatures on Venus
and at least 33 degrees C of normal warming here on Earth, are on
the rise. Our planet seems destined for a hot future!
But is it really? Or are we simply
experiencing a natural variation in Earth's climate cycles that
will return to "normal" in time?
Correlations between rising CO2
levels and global surface temperatures suggest that our planet is
on a one-way warming trend triggered by human activity. Indeed,
studies by paleoclimatologists reveal that natural variability caused
by changes in the Sun and volcanic eruptions can largely explain
deviations in global temperature from 1000 AD until 1850 AD, near
the beginning of the Industrial Era. After that, the best models
require a human-induced greenhouse effect.
They argue that natural variations
in climate are considerable and not well understood. The Earth has
gone through warming periods before without human influence, they
note. And not all of the evidence supports global warming. Air temperatures
in the lower atmosphere have not increased appreciably, according
to satellite data, and the sea ice around Antarctica has actually
been growing for the last 20 years. It may surprise many people
that science -- the de facto source of dependable knowledge
about the natural world -- cannot deliver an unqualified, unanimous
answer about something as important as climate change.
Why is the question so thorny? The
reason, say experts, is that Earth's climate is complex and chaotic.
It's so unwieldy that researchers simply can't conduct experiments
to check their ideas in the usual way of science. They often rely,
instead, on computer models. But such models are only as good as
there inputs and programming, and today's computer models are known
to be imperfect.
Most scientists agree that no single
piece of data will likely resolve the global warming debate. In
the end, the best we can expect is a scientific consensus based
on a preponderance of evidence.
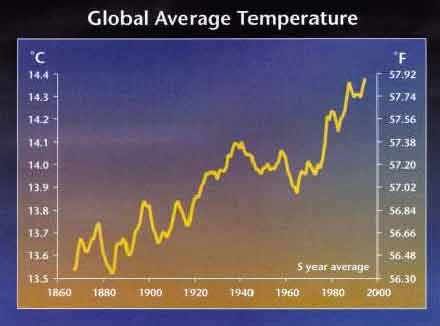
Global Average
Temperatures 1860-2000
|
The
canary in the coalmine?
The recent discovery that Greenland's
ice sheet is thinning is a good example of our climate's sometimes
vexing ambiguity. About 85 percent of Greenland is covered by a
massive ice sheet with an area of about 1,736,000 square kilometres
and an average thickness of about 1,500 meters. The volume
of ice in the Greenland sheet is estimated to be about 2,600,000
cubic kilometres -- enough ice to raise sea levels by 6.4 meters
if it all were to melt.
While it is only about one-seventh
the size of the Antarctic ice sheet, some scientists think that
watching the ice on Greenland provides better clues about global
warming.
"Even though Antarctica is seven
times the size of Greenland, because (Antarctica is) kind of symmetrically
positioned around the South Pole, it doesn't really interact with
climate up in the more temperate regions the way Greenland does,"
said Dr. William Krabill at NASA's Wallops Flight Facility. Krabill
is the project scientist for the team that discovered the thinning. "Greenland
... is likely to be a better indicator of global climate change
than Antarctica," he noted.
Krabill's team used an airborne laser
to survey the altitude of the ice sheet's surface during 1993 and
1994. They repeated their survey in 1998 and 1999, making certain
to retrace their flight paths from the first survey as closely as
possible.
After incorporating some assumptions
that let them extend their measurements to the sheet's edges, the
scientists compared the second survey to the first. They found that
the ice sheet's surface was slightly higher at the centre but considerably
lower at the edges -- particularly the southeastern edge.
The overall result: The ice sheet lost
at least 51 cubic kilometres of volume during that five-year period.
Greenland appeared to be melting!
Many newspaper headlines cried the
discovery as a sign of global warming -- which most readers presumably
took to mean "anthropogenic," or human-caused, global
warming.
But is that the right conclusion?
"What you can say is, yes, carbon
dioxide (in the atmosphere) is at levels higher than ever before,
and carbon dioxide is a greenhouse gas, so it's reasonable to say
that there's warming associated with the increase of carbon dioxide,"
said Dr. Waleed Abdalati, co-author of the paper that announced
the Greenland discovery.
"But you can't make the leap yet
that all the cars in the world have led to what we're observing
in the thinning of the Greenland ice sheet," Abdalati said.
If there's one lesson to be learned
from science, it's that things are usually much more complex than
they at first appear. The warming trend of the last century may
seem to be the obvious explanation for the thinning seen on Greenland,
but scientists are considering other possibilities.
"That's what science is about,"
said Dr. Ellen Mosley-Thompson, a research scientist at the Byrd
Polar Research Centre at The Ohio State University.
"Just because you have an hypothesis
and immediately your experiment produces support for it, you can't
simply accept those results (without a degree of scepticism),"
Mosley-Thompson said. "The whole idea is to play devil's advocate
on your own research before your colleagues do."
Last century's warming trend is not
the only possible explanation for the thinning that Krabill's team
saw on Greenland.
In fact, ice cores taken as part of
another NASA-funded study suggest that natural variation in snowfall
may be partly to blame, Mosley-Thompson said.
"The ice core data provide evidence
-- not necessarily conclusive -- that Bill's results may in part
reflect variability in snow accumulation over his five-year observational
window," said Mosley-Thompson, who co-authored the paper reporting
these results with Dr. Joseph McConnell, an associate research professor
at The Desert Research Institute in Reno, Nevada. The results of
the study were published in the August 24 edition of the journal
Nature.
Other natural processes could account
for the thinning as well. Ocean currents might have caused part
of the change. Or the flux of warm water into the North Atlantic
caused by the 1990-1996 positive phase of the slow-moving North
Atlantic Oscillation could have had an influence. The ice sheet
could also be thinning in response to the long-term warming of the
planet since the transition from the last glacial period about 10,000
years ago. Krabill, Dr. Ron Kwok of NASA's Jet Propulsion Laboratory,
and Abdalati mentioned these scenarios during interviews with http://science.nasa.gov/.
Scientists often refer to these alternate
explanations under the umbrella term of "natural variability."
The
ant on the hour hand
"For the ordinary person, it's
a common misperception that weather is not changing ... that last
winter is about as cold as this winter and last summer is about
as warm ... and the world is pretty much constant," Krabill
said. "That's not true. The Earth has gone through and continues
to go through cycles of warming and cooling. It's just natural."
This natural variability often shows
an astounding degree of complexity, much of which remains poorly
understood.
"We've only begun making (large
scale) measurements in the last 100 to 150 years," Abdalati
said. "And climatic processes happen on very different time
scales. There are some, like ice ages, that are in the tens of thousands
or hundreds of thousands of years long. An then there are atmospheric
processes like weather, which happen on the scales of hours and
days."
The Climate
Puzzle
When is a trend a trend?
|
Other climate cycles fall in between,
such as the North Atlantic Oscillation mentioned above, which is thought
to complete one cycle roughly every 20 to 30 years.
"And so you have all these processes
mixed together that have been going on for thousands of years, and
you're in the difficult position of trying to separate something
very recent from the natural cycle without fully understanding what
that natural cycle is," Abdalati said.
Observing a system like climate that
varies on several time scales -- some of which approach geological
slowness -- could be likened to an ant watching the hands of a clock,
"perhaps with the ant sitting on the hour hand," Abdalati
added.
Seen in this context, scientists don't
give much weight to the five-year snapshot of the ice on Greenland.
"You know, five years is a pretty
short amount of time in glaciological terms," Krabill said.
"To try to make inferences about 'Global Climate Change' in
capital letters from a five-year period of time is a pretty risky
business."
Other modern data sets are not much
longer. The era of satellite observation is only about 30 to 40
years old -- a mere blink in climatological terms. And the widespread
network of weather-measurement stations in the developed world is
about 150 years old.
The
Ghost of Climates Past
Greater insight about the role of natural
variability may come from the field of paleoclimatology -- a specialized
branch of climatology that uses scientific sleuthing to summon the
ghost of climates past.
Trees show
the fingerprints of Earth's Climate
|
The "fingerprints" of Earth's
climate hundreds or even thousands of years ago remain imprinted in
the rings of temperature-sensitive trees, the chemicals trapped in
ancient ice, and the layers of sediment on the ocean floor.
Several studies by paleoclimatologists
have suggested that natural variability can't fully explain the
warming of the last century.
For example, Dr. Thomas J. Crowley,
a geologist at Texas A&M University, used similar techniques
to reconstruct basic climate data -- such as average global temperature
-- back to 1000 A.D.
Crowley examined natural climate variations
in a simple computer climate model caused by two external influences:
fluctuations in the sun's intensity and aerosols injected into the
atmosphere by volcanoes.
He deduced the history of solar flux
from concentrations of carbon-14 in tree rings and of beryllium-10
in ice cores. Then, he deciphered past volcanic activity from sulphate
aerosol deposits in ice cores.
Crowley ran the computer climate model
with the solar and volcanic forcing terms, then compared the average
temperatures it produced with a temperature record constructed from
tree-ring data.
Despite the relative simplicity of
his model, Crowley found good agreement between the temperature
fluctuations it calculated for the years 1000 AD to 1850 AD and
the fluctuations actually measured from tree rings during that interval.
Over that 850-year period, fluctuations in solar intensity along
with volcanic eruptions could account for roughly 50 percent of
the variation seen in the tree-ring record -- give or take 10 percent.
Something happened, however, after
1850. Crowley's model could only account for about 25 percent of
the observed temperature changes. Something else was needed -- volcanic
eruptions and solar variability were not enough.
Crowley then introduced a human-triggered
greenhouse effect to the model and it produced a much better match.
"It all comes out as indicating
that you can't resort to (natural variability) to explain the recent
warming," Crowley said. "The (recent) warming is consistent
with a greenhouse effect but inconsistent with any explanation from
natural variability."
So with the weight of a 1,000-year
climate record on human shoulders, can scientists finally say that
they've proven humanity is causing an unnatural warming of
the globe?
Not necessarily.
"The time series we developed
is statistically significant -- highly significant," Crowley
said. "That doesn't prove something is right, but it
still makes a good case that we're on the right track."
The
problem with the "P" word --Proof!
From a statistical point of view, no
single scientific result based on real-life data ever deserves absolute
confidence. There always lingers the possibility -- however small
-- that the apparent results are due to chance patterns in the data,
i.e., "noise."
In the case of Crowley's study, statistical
tests show that the probability of his results being due to chance
is less than 1 percent. Usually, anything less than 5 percent is
considered credible.
"This is not mathematics where
you can prove something and write Q.E.D. at the bottom of the page,"
Crowley said. "This is geoscience. It's a dirtier field, and
usually you make statistical arguments."
The abbreviation stands for the Latin
phrase quod erat demonstrandum, which means, "which
was to be demonstrated." Mathematicians use "Q.E.D."
to indicate the end of the written proof of a theorem, which, if
correct, is considered absolute.
In addition to the caveats inherent
to statistics, conclusions from studies like Crowley's that are
based on computer simulations of the world's climate are plagued
by questions of how well computer models portray the real thing.
To prove causation, scientists must
perform experiments under controlled conditions on the system being
studied, manipulating the system to understand what causes what.
Other scientists repeat the experiments to show that the explanation
is reliable.
Since the Earth's climate is beyond
the reach of such experimentation, scientists instead run computer
simulations of global climate. These models are always much simpler
than the Earth's climate itself. In fact, it's theoretically impossible
to create a "perfect" model of climate that includes all
the detail of the real system.
"The climate system is too complex,"
Mosley-Thompson said. "Even the most complex climate model
doesn't get it right. And why is that? Because who writes the climate
models? Humans. What is a climate model? It's a set of equations
that describes what we think we know. If you're not cognizant of
a particular phenomenon, then how can you incorporate it into a
climate model?"
The fact that different computer models
often produce different forecasts doesn't offer much reassurance.
For example, one model predicted that the Southeastern U.S. would
become more jungle-like in the next century, while another model
predicted the same region would become a dried-out savannah, according
to Dr. John Christy, a professor of atmospheric science at the University
of Alabama in Huntsville.
However, scientists can establish some
degree of confidence in their computer models by seeing if the model
can accurately "predict" past climate patterns that are
known to science.
"Models in isolation may not be
believable, but when ... a model can simulate a number of different
observed climate responses, the results have more weight than mere
calculation," Crowley said. "That still doesn't prove
the point, but it minimizes the value of the argument, 'It's only
a model.'"
Putting
the pieces together
Ultimately, the verdict from science
about the extent and cause of global climate change may not come
from one particular study or observation.
"I think from the viewpoint of
thoughtful scientists, there's not going to be any single indicator,
but rather there's going to be a concurrency of lots of indicators
that's going to be convincing," said Dr. Tony Rosenbaum, a
professor at the University of Florida who specializes in the politics
of environmental issues.
Showing how
greenhouse gases are trapped in the atmosphere
|
While the "big picture" view
of all the evidence from research around the world may offer scientists
their best chance to understand global warming, no mathematical
tools exist for combining all the data into a definitive, objective
conclusion. Scientists' only option is to weigh the evidence
and make a professional judgment.
"There is a dichotomy between
what is realistic and achievable, and what some people would like
to hold as the ideal proof," Mosley-Thompson said.
"I don't think this discussion
lends itself to standard statistical testing," she continued.
"Certainly you can test, statistically, the output of one climate
model against another, a climate model against observation, an ice
core data against observation -- but those are snippets .... What
does it mean for reality? There's where the translation becomes
difficult."
When drawing a conclusion from the
mosaic of evidence, different scientists will use different criteria,
Crowley said.
"I think that there are many scientists
that are still locked into the idea that we have to prove something
(about causes of climate change) beyond a reasonable doubt,"
Crowley said. "I don't think we necessarily have to do that.
... In a court of law you can convict based on a weight of evidence.
... That's the way you approach this type of problem."
Because such conclusions are based
on a scientist's professional judgment, disagreement is inevitable.
"There is enormous room for differences
of opinion among equally competent scientists of good will,"
Rosenbaum concluded.
"There are always people -- and
reasonable people -- who fall on both sides of the argument,"
agreed Abdalati. "And there are reasons for that. So the best
we can hope for is a consensus."
|